 TSXV: SMWE
基于遥感技术的农业保险解决方案
基于卫星与无人机遥感技术,实现农业保险精准承保、快速查勘定损,降本增效。
1. Market Background of Agricultural Insurance
Agriculture is one of the industries most significantly affected by natural conditions. Most agricultural regions worldwide face frequent and severe natural disasters such as droughts, floods, typhoons, hailstorms, low-temperature freezes, and pests and diseases. Against this backdrop, the risk protection and economic compensation functions of agricultural insurance are becoming increasingly prominent, and post-disaster claim funds have become an important source of financing for restoring production and rebuilding agricultural infrastructure in disaster-affected areas. Agricultural insurance plays an irreplaceable role in stabilizing agricultural production, protecting farmers' income, and safeguarding food security.
2. Core Issues in Agricultural Insurance Operations
As the scale of agricultural insurance business continues to expand, insurance institutions face a contradiction between operational efficiency and refined management, prominently manifested as information asymmetry, moral hazard, and claims efficiency issues, which constrain the economic compensation, financing, and social management functions of agricultural insurance.
In the underwriting process, it is difficult to accurately determine the location, boundaries, and area of insured plots, making risk control challenging. In the claims process, professional technical support is insufficient for areas with severe damage, large affected areas, and harsh on-site survey conditions, leading to universally high claims costs, low efficiency, and difficulty in ensuring the accuracy of loss assessment.
3. Innovative Application of Remote Sensing Technology in Agricultural Insurance
By introducing spatial information technology and comprehensively applying satellite and drone remote sensing, the spatial management of insured objects can be realized, gradually building a smart agricultural insurance service system centered on customers and supported by spatial data. This provides spatial data and analytical management capabilities for underwriting and claims, effectively addressing pain points such as information asymmetry, high claims costs, and low efficiency.
3.1 Underwriting
Integrate insured object attribute information with spatial information to promote refined management of agricultural insurance underwriting and enhance the ability to identify and control underwriting risks.
3.2 Claims
Use remote sensing and spatial technologies for rapid disaster assessment, timely grasp the scope and distribution of affected areas, thereby conducting targeted survey and loss assessment, reducing claims costs, and improving claims efficiency.
4. Technical Process of Agricultural Insurance Underwriting Based on Satellite Remote Sensing
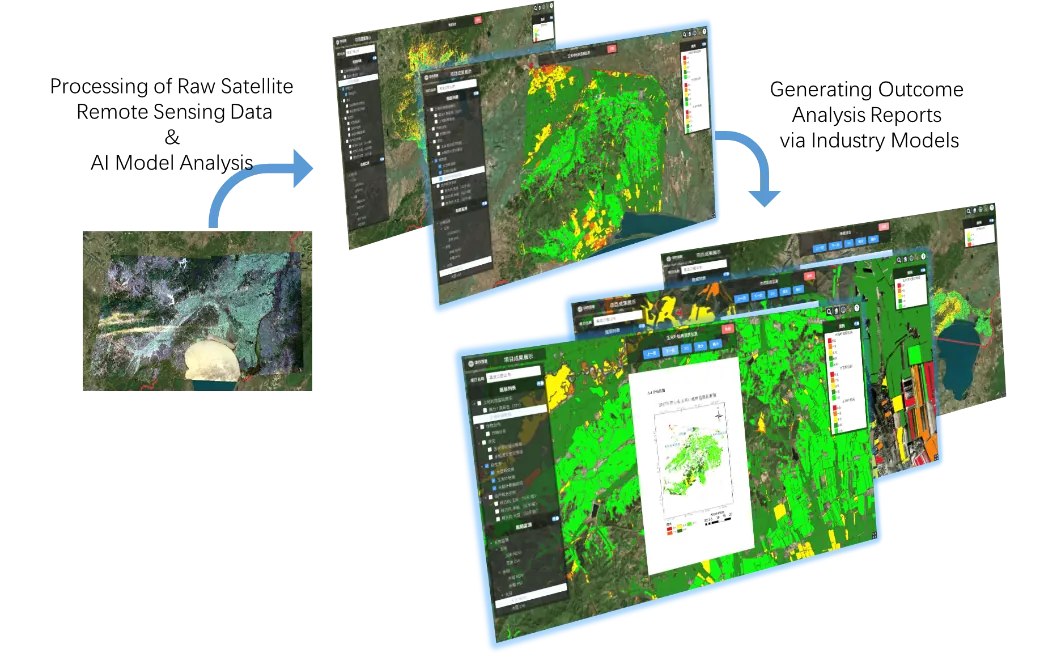
The workflow of map-based underwriting is as follows. Before underwriting, use satellite remote sensing supplemented by drone remote sensing to extract and map the spatial distribution of crops in the target area and estimate the area, forming a multi-layered distribution map of insured objects. During underwriting, combine basic geographic information data, remote sensing data, historical disaster data, and underwriting/claims business data to assess comprehensive crop disaster risks, supporting rate making and underwriting approval, and issue policies based on spatial information maps. During the insurance period, use satellite remote sensing to dynamically monitor crop growth and conduct risk assessment, providing crop risk management services for insured farmers or agricultural enterprises.
4.1 Main Technical Steps
• Historical disaster data and satellite remote sensing imagery: serve as the basic input for risk analysis and assessment.
• Comprehensive crop risk map: generated based on multi-source data overlay analysis.
• Rate making: determine differentiated rates based on risk maps and historical loss data.
• Crop identification and area estimation: extract crop spatial distribution by region and administrative division.
• Plot identification and extraction: form insured plot boundaries and distribution maps.
• Spatialized insured object information and policy issuance: map-based underwriting, realizing spatial mapping of insured objects.
4.2 Process Services
• Crop risk management services: covering distribution of insured crops by type and statistics of insured crop area.
• Crop growth monitoring and disaster risk assessment, with results verified through on-site handheld terminals and multi-rotor drone sampling.
5. Technical Process of Agricultural Insurance Claims Based on Satellite Remote Sensing
The workflow of map-based claims is as follows. First, based on medium-high resolution remote sensing imagery and prior knowledge, conduct a rapid overall disaster assessment to determine disaster levels in each area. Second, based on the overall disaster assessment results, assist relevant departments in disaster relief to minimize losses. At the same time, use satellite remote sensing, drones, and other technologies to conduct detailed surveys. Finally, based on satellite remote sensing imagery, drone imagery, regional basic geographic information, and underwriting information, conduct a comprehensive loss assessment and produce a loss assessment report, supporting accurate and rapid claims and realizing map-based claims.
5.1 Rapid Assessment Phase
• Based on medium-high resolution remote sensing imagery and prior knowledge, combined with drone imagery of disaster areas, identify and extract affected crops.
• Through zoning and quadrat sampling, ground surveys, and loss estimation algorithms/models, output rapid assessment results of affected scope, disaster level maps, and affected quantities.
• Support refined disaster relief and claims scheduling, and assist relevant departments in emergency response.
5.2 Accurate Claims Phase
• For severely affected and insured areas, combine high-resolution imagery identification with ground surveys to conduct supplementary surveys.
• Collect field data through on-site handheld terminals and multi-rotor drones to refine loss estimation algorithms/models.
• Output accurate affected scope, disaster level maps, and affected quantities, forming the basis for map- and data-based claims.
6. Technical Parameter Reference for Typical Commercial Hyperspectral Remote Sensing Satellites
This solution can integrate various commercial remote sensing satellite data sources. Below are examples of typical hyperspectral satellite technical parameters; in actual projects, they can be flexibly selected based on regional coverage, revisit period, and resolution requirements.
Item | Parameter | Item | Parameter |
Launch date | April 2018 | Channel no. / central wavelength | Channel no. / central wavelength |
Swath width | 150 km | 1 | 466 nm |
Imaging range | 150 km × 2500 km | 2 | 480 nm |
Orbit | Sun-synchronous orbit, altitude 500 km | 3 | 500 nm |
Revisit period | 10 days (single satellite) / 2 days (4-satellite constellation) | 4 | 520 nm |
Spatial resolution | 10 m | 5 | 536 nm |
Number of bands | 32 | 6 | 550 nm |
True color composite | 14, 7, 2 (or 15, 5, 1) | 7 | 566 nm |
Band range | 400 nm – 1000 nm | 8 | 580 nm |
|
| 9 | 596 nm |
|
| 10 | 610 nm |
|
| 11 | 626 nm |
|
| 12 | 640 nm |
|
| 13 | 656 nm |
|
| 14 | 670 nm |
|
| 15 | 686 nm |
|
| 16 | 700 nm |
|
| 17 | 716 nm |
|
| 18 | 730 nm |
|
| 19 | 746 nm |
|
| 20 | 760 nm |
|
| 21 | 776 nm |
|
| 22 | 790 nm |
|
| 23 | 806 nm |
|
| 24 | 820 nm |
|
| 25 | 836 nm |
|
| 26 | 850 nm |
|
| 27 | 866 nm |
|
| 28 | 880 nm |
|
| 29 | 896 nm |
|
| 30 | 910 nm |
|
| 31 | 926 nm |
|
| 32 | 940 nm |
Example of data product naming convention:
HCZ2_YYYYMMDDhhmmss_0008_L1_MSS_CCD2, where the prefix indicates the satellite number, the middle section is the data reception time (year-month-day-hour-minute-second), and the rear section is the data level and sensor identifier. In actual projects, various commercial satellite constellations can be integrated, including multispectral satellites, high-resolution optical satellites, and radar satellites, forming a remote sensing data service capability with multi-source data complementarity.
7. Service Content
Based on the agricultural remote sensing big data platform, this solution provides the following core services for insurance institutions and agricultural business entities:
• Agricultural insurance verification system: supports the full-process online management of spatial mapping of insured objects and claims survey/loss assessment.
• Arable land area and crop distribution extraction: dynamically outputs crop planting structure and planting area by region.
• Crop growth monitoring: tracks crop growth status based on time-series remote sensing imagery.
• Soil data monitoring: combines ground sampling with remote sensing inversion to assess soil moisture and fertility.
• Natural disaster level prediction: integrates meteorological, remote sensing, and historical disaster data to provide disaster risk early warning.
• Crop yield estimation: outputs regional yield estimation results based on growth models and historical unit yields.
一、农业保险市场背景
农业是受自然条件影响最为显著的产业之一,全球多数农业区域均面临干旱、洪涝、台风、冰雹、低温冻害、病虫害等自然灾害频发且灾情较重的问题。在此背景下,农业保险的风险保障与经济补偿作用日益凸显,灾后理赔资金已成为受灾区域恢复生产、重建农业基础设施的重要资金来源。农业保险在稳定农业生产、保障农户收入和维护粮食安全方面发挥着不可替代的作用。
二、农业保险经营中的核心问题
随着农业保险业务规模的持续扩大,保险机构在经营过程中面临工作效率与精细化管理之间的矛盾,突出表现为信息不对称、道德风险与理赔效率等问题,制约了农业保险经济补偿、资金融通和社会管理职能的发挥。
在承保环节,难以精确确定承保地块的位置、边界和面积等信息,承保风险管控难度较大;在理赔环节,对于受灾严重、受灾面积大、现场勘察环境恶劣的区域,专业技术支撑不足,普遍存在理赔成本高、效率低、定损准确性难以保证等难题。
三、遥感技术在农业保险中的创新应用
引入空间信息技术,综合运用卫星遥感与无人机遥感技术,可实现保险标的的空间化管理,逐步构建以客户为中心、以空间数据为支撑的智慧农业保险服务体系,为承保和理赔业务提供空间数据与分析管理能力,有效解决信息不对称、理赔成本高和效率低等痛点。
(一)承保环节
整合标的属性信息与空间信息,推动农业保险承保精准化管理,提升承保风险识别与管控能力。
(二)理赔环节
运用遥感及空间技术进行灾情快速评估,及时掌握受灾范围与分布,从而开展针对性的查勘定损工作,降低理赔成本,提高理赔效率。
四、基于卫星遥感技术的农业保险承保技术流程
按图承保工作流程如下:在承保前,通过卫星遥感技术并辅以无人机遥感技术,对目标区域内的农作物进行空间分布提取与制图,并开展面积估算,形成多层次的标的分布图;在承保时,结合基础地理信息数据、遥感数据、历史灾情数据和承保理赔业务数据,评估农作物灾害综合风险,为费率厘定和核保提供支撑,并依据空间信息图完成承保出单;在承保期间,利用卫星遥感对农作物长势进行动态监测与危险性评估,为投保农户或农业企业提供农作物风险管理服务。
(一)主要技术环节
• 历史灾情数据与卫星遥感影像:作为风险分析与评估的基础输入。
• 农作物综合风险图:基于多源数据叠加分析生成。
• 费率厘定:依据风险图与历史损失数据确定差异化费率。
• 农作物识别与面积估算:按区域、行政分区提取农作物空间分布。
• 地块识别与提取:形成标的地块边界与标的分布图。
• 空间化标的信息与承保出单:按图承保,实现标的空间落图。
(二)过程服务
• 农作物风险管理服务:覆盖投保分类型作物分布、投保区域作物面积统计。
• 农作物长势监测与灾害风险评估,结果经现场手持终端与多旋翼无人机采样验证。
五、基于卫星遥感技术的农业保险理赔技术流
按图理赔工作流程如下:首先,基于中高分辨率遥感影像和先验知识,进行灾情总体快速评估,确定各区域灾情等级;其次,依据总体灾情评估结果,协助相关部门开展救灾工作,将损失降到最低。同时利用卫星遥感、无人机等技术开展详细勘察,最后基于卫星遥感影像、无人机影像、区域基础地理信息和承保信息,进行全面损失评估,形成损失评估报告,为精确、快速理赔提供支撑,实现按图理赔。
(一)快速评估阶段
• 基于中高分辨率遥感影像与先验知识,结合灾区无人机影像,开展受灾作物识别与提取。
• 通过分区与样方抽样、地面调查及估损算法模型,输出受灾范围、受灾等级图和受灾数量的快速评估结果。
• 支撑精细化救灾及理赔调度,辅助相关部门开展应急响应。
(二)精确理赔阶段
• 针对重灾区与投保区域,采用高分辨率影像识别与地面调查相结合的方式,开展补充勘察。
• 通过现场手持终端与多旋翼无人机采集实地数据,修正估损算法模型。
• 输出精确的受灾范围、受灾等级图与受灾数量,形成按图及数据理赔的依据。
六、典型商业高光谱遥感卫星技术参数参考
本方案可接入多种商业遥感卫星数据源,以下为典型高光谱遥感卫星技术参数示例,实际项目中可根据区域覆盖、重访周期和分辨率需求灵活选择。
项目 | 参数 | 项目 | 参数 |
发射时间 | 2018年4月 | 通道数 / 中心波长 | 通道数 / 中心波长 |
幅宽 | 150 km | 1 | 466 nm |
成像范围 | 150 km × 2500 km | 2 | 480 nm |
运行轨道 | 太阳同步轨道,轨道高度 500 km | 3 | 500 nm |
重返周期 | 10天(单星)/ 2天(四星组网) | 4 | 520 nm |
空间分辨率 | 10 m | 5 | 536 nm |
波段数 | 32 个 | 6 | 550 nm |
真彩色组合 | 14, 7, 2(或 15, 5, 1) | 7 | 566 nm |
波段范围 | 400 nm – 1000 nm | 8 | 580 nm |
|
| 9 | 596 nm |
|
| 10 | 610 nm |
|
| 11 | 626 nm |
|
| 12 | 640 nm |
|
| 13 | 656 nm |
|
| 14 | 670 nm |
|
| 15 | 686 nm |
|
| 16 | 700 nm |
|
| 17 | 716 nm |
|
| 18 | 730 nm |
|
| 19 | 746 nm |
|
| 20 | 760 nm |
|
| 21 | 776 nm |
|
| 22 | 790 nm |
|
| 23 | 806 nm |
|
| 24 | 820 nm |
|
| 25 | 836 nm |
|
| 26 | 850 nm |
|
| 27 | 866 nm |
|
| 28 | 880 nm |
|
| 29 | 896 nm |
|
| 30 | 910 nm |
|
| 31 | 926 nm |
|
| 32 | 940 nm |
数据产品命名规则示例:HCZ2_YYYYMMDDhhmmss_0008_L1_MSS_CCD2,其中前缀表示卫星编号,中段为数据接收时间(年-月-日-时-分-秒),后段为数据级别与传感器标识。实际项目中可对接多种商业卫星星座,包括多光谱卫星、高分辨率光学卫星及雷达卫星等,形成多源数据互补的遥感数据服务能力。
七、服务内容
本方案依托农业遥感大数据平台,面向保险机构与农业经营主体提供以下核心服务:
• 农业保险核查系统:支持承保标的空间落图、理赔查勘定损的全流程线上化。
• 耕地面积及作物分布提取:按区域动态输出作物种植结构与种植面积。
• 农作物长势监测:基于时序遥感影像跟踪作物生长状态。
• 土壤数据监测:结合地面采样与遥感反演,评估土壤墒情与肥力。
• 自然灾害等级预测:融合气象、遥感与历史灾情数据,开展灾害风险预警。
• 农作物产量预估:基于长势模型与历史单产,输出区域产量预估结果。
• 无人机采集系统:作为卫星遥感的补
← 客户场景