 TSXV: SMWE
Smartwell 以大规模农业智能服务展现农业遥感实力
高分辨率卫星影像与农业分析数据服务,让大面积农业观测转化为可落地的信息。
Smartwell Technology Corp. (TSXV: SMWE) ("Smartwell" or the "Company") highlights its agricultural remote sensing capabilities through a large-scale agricultural intelligence service delivered for a client in Heilongjiang Province, China.
The service covered approximately 7,728 square kilometers, representing a complete city-level administrative area. Using Gaofen-2 (GF-2) high-resolution satellite imagery, including panchromatic and visible-band multispectral imagery, the service provided agricultural and land-use mapping, crop identification, crop production estimation, disease and pest assessment, and agricultural disaster assessment.
The work demonstrates how satellite-based remote sensing can transform agricultural information from scattered observations and statistical data into spatially organized, measurable and analyzable information.
Seeing Agriculture Across an Entire City
For large agricultural regions, one of the fundamental challenges is not simply obtaining agricultural statistics, but understanding where agricultural activities and risks are located.
Traditional agricultural surveys generally depend on field visits, sampling, statistical reporting and information collected from different locations. These approaches remain important, but at the scale of thousands of square kilometers, obtaining consistent information across an entire administrative area can be difficult.
Remote sensing provides a different way to observe agriculture.
Satellite imagery can capture large areas in a consistent spatial framework, allowing agricultural land, crop types and areas affected by environmental events to be identified and mapped. Instead of treating an agricultural region only as a collection of statistical figures, remote sensing can represent it as a spatial dataset that can be analyzed geographically.
For a large agricultural region, this distinction is important. Decision-makers may need to know not only how much agricultural land exists, but also which areas are planted with specific crops, where production is concentrated, and where agricultural impacts are occurring.
From Satellite Images to Agricultural Information
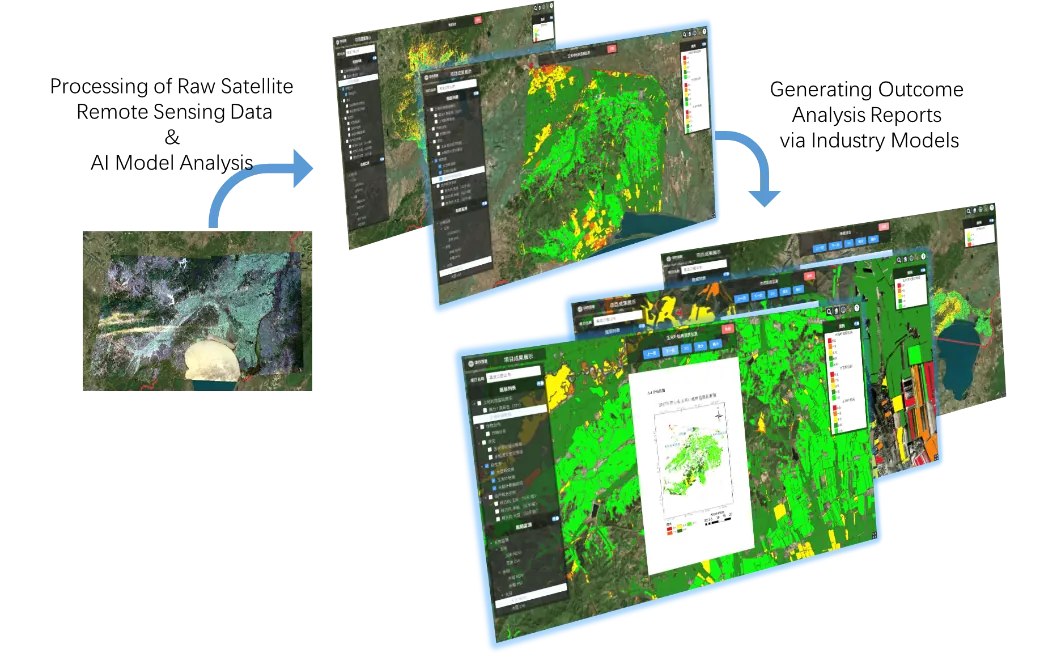
The service used GF-2 satellite imagery together with image processing, spatial analysis and agricultural models.
Rather than treating satellite imagery as the final product, the service transformed raw remote sensing data into structured agricultural information through specialized data processing, AI-based analysis and agricultural models. This process turned large volumes of satellite observations into information that could be visualized, analyzed and directly applied to agricultural assessment and decision-making.
The resulting service included four major areas.
1. High-Accuracy Crop and Land-Use Mapping
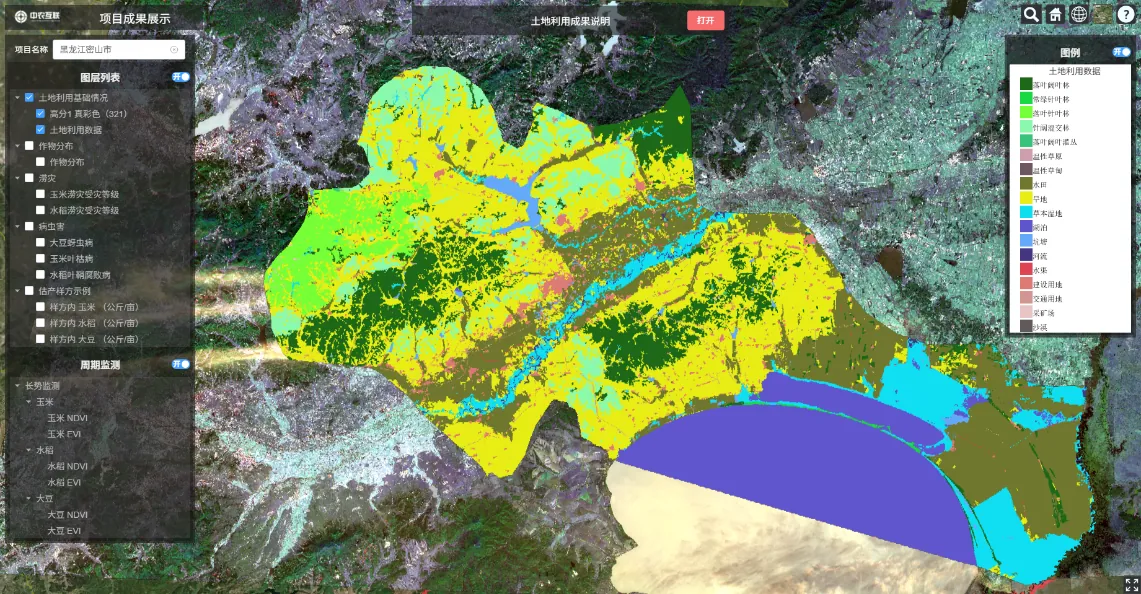
The service generated a land-use and land-cover classification covering 18 secondary categories, including paddy fields, dry land, rivers, wetlands and deciduous broadleaf forests.
The overall classification accuracy reached 91%.
For three major crops — rice, corn and soybean — the overall identification accuracy reached 98.4%, with a recall rate of 96.36%.
These results demonstrate the ability of high-resolution satellite imagery and agricultural remote sensing methods to distinguish major agricultural crop types at a large geographic scale.
More importantly, the output was spatially organized, allowing crop information to be associated with specific locations rather than existing only as aggregate statistics.
2. Crop Production Estimation
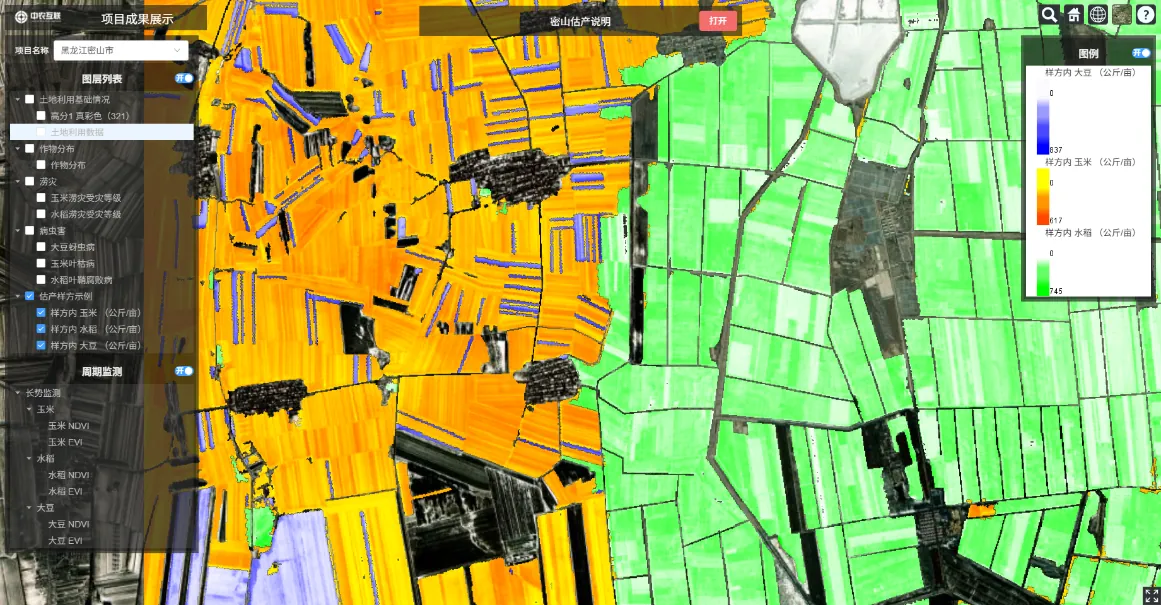
Crop production estimation combined remotely sensed crop-area extraction with crop yield models.
Within designated experimental areas inside the monitored region, the service generated production estimates of approximately 316 million kilograms for rice, 835 million kilograms for corn, and 45 million kilograms for soybean.
These figures represent estimates for the designated experimental areas used in the analysis and do not represent the total production of the entire 7,728-square-kilometer monitored region.
The significance of this approach is that satellite remote sensing can provide the spatial crop-area information needed by production models, while agricultural models can translate crop-area and related information into production estimates.
This creates a connection between what is observed from space and what is estimated about agricultural production on the ground.
3. Spatial Disease and Pest Assessment
The service also assessed the severity of selected crop diseases and pests.
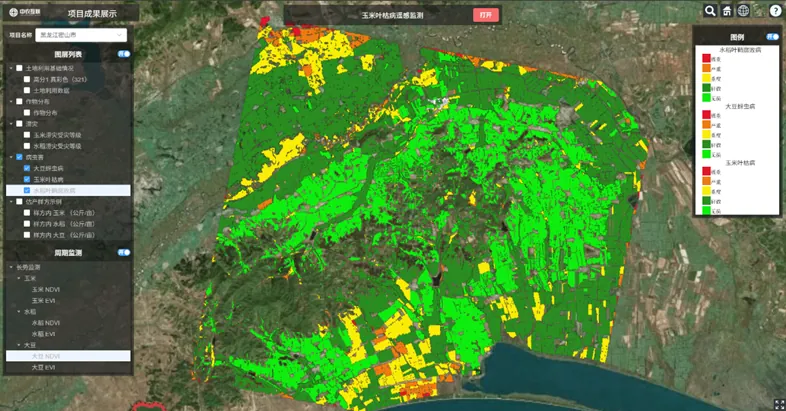
For rice sheath rot, corn leaf blight and soybean aphids, the analysis established a five-level assessment ranging from none to extreme.
Rather than providing only a general statement that a disease or pest problem existed, the analysis provided information on its spatial distribution and severity.
Such information can support more targeted agricultural management, including the identification of areas requiring closer inspection, targeted application and prevention measures.
4. Assessing Agricultural Impacts After Extreme Rainfall
Remote sensing was also used to assess agricultural impacts following extreme rainfall.
By comparing satellite images acquired on different dates, the service identified areas showing agricultural impacts and analyzed their spatial distribution.
The analysis indicated that impacts on corn were concentrated in low-lying areas around reservoirs, while impacts on rice were primarily distributed along the edges of major water bodies.
This type of spatial information can support post-disaster assessment and help identify areas where agricultural production may be more exposed to similar risks.
What Changes When Agricultural Information Becomes Spatial?
The value of agricultural remote sensing is not simply that information can be collected from satellites.
Its value lies in changing how agricultural information is obtained, organized and used.
A conventional field-based approach typically requires personnel to visit locations, collect observations and combine information from multiple points. For a large geographic area, this can make comprehensive spatial coverage difficult to achieve consistently.
Remote sensing changes the observation process by providing a common spatial reference across a large area.
This does not eliminate the need for field surveys. Instead, it can make field work more targeted.
For example, satellite analysis can first identify crop distributions, areas with potential agricultural impacts or locations showing significant changes. Field personnel can then focus additional investigation on areas that require verification or more detailed assessment.
Remote sensing also makes it possible to compare observations from different dates. This allows changes in agricultural conditions to be examined spatially rather than relying exclusively on separate field observations or statistical reports.
The result is not simply another image. It is a structured agricultural dataset that can be used for mapping, comparison, analysis, reporting and subsequent decision-making.
For large agricultural regions, this creates a more systematic connection between observation and agricultural management.
Yuntong and the Broader Intelligent Agriculture Platform
The agricultural remote sensing service described above represents one of the capabilities supported by Smartwell's Yuntong agricultural data platform.
Yuntong is designed to integrate multiple sources of agricultural information, including satellite imagery, UAV imagery, weather information, agricultural IoT data and AI-based analytics. By bringing these sources together, the platform can support agricultural observation and analysis at different spatial and temporal scales.
Smartwell is continuing to develop these capabilities as part of its broader Intelligent Agriculture strategy, with applications spanning large-scale outdoor agriculture and controlled-environment agriculture. The Company aims to connect agricultural observations, data analysis and agricultural models through digital platforms to support practical agricultural management.
About Smartwell Technology Corp.
Smartwell Technology Corp. (TSXV: SMWE) is focused on the development and application of technologies for Intelligent Agriculture, agricultural data services and controlled-environment agriculture.
Through its technology platforms and agricultural applications, the Company is developing capabilities spanning agricultural remote sensing, data integration, AI-based agricultural analysis and digital agricultural management.
Smartwell's strategy is to connect agricultural data with practical agricultural applications, supporting the digital transformation of both large-scale outdoor agriculture and controlled-environment production.
Smartwell Technology Corp.(多伦多证交所创业板:SMWE)(下称「Smartwell」或「公司」)通过为黑龙江省某客户交付的大规模农业智能服务,重点展示其农业遥感能力。
该服务覆盖约 7,728 平方公里,为一个完整的市级行政区。服务采用高分二号(GF-2)高分辨率卫星影像(含全色与可见光多光谱),提供农业与土地利用制图、作物识别、作物产量估算、病虫害评估与农业灾害评估。
这项工作展示了卫星遥感如何将农业信息从零散观测与统计数据,转化为空间化组织、可度量、可分析的信息。
看清一座城市的农业
对大型农业区域而言,根本挑战之一不只是拿到农业统计数据,而是弄清农业活动与风险「在哪里」。
传统农业调查通常依赖实地走访、抽样、统计上报与多点信息汇总。这些方式依然重要,但在数千平方公里的尺度上,要拿到覆盖整个行政区的一致信息并不容易。
遥感提供了另一种观察农业的方式。
卫星影像能在统一的空间框架下捕捉大面积区域,识别并制图农业用地、作物类型与受环境事件影响的区域。它把农业区域从「一组统计数字」变成「可进行地理分析的空间数据集」。
对大型农业区域,这一区别意义重大:决策者需要知道的不只是有多少农业用地,还包括哪些区域种植了特定作物、产量集中在哪里、农业影响发生在何处。
从卫星影像到农业信息
该服务采用 GF-2 卫星影像,结合影像处理、空间分析与农业模型。
服务并不把卫星影像当作最终产品,而是通过专业的数据处理、AI 分析与农业模型,把原始遥感数据转化为结构化的农业信息——让海量卫星观测变成可视化、可分析、可直接用于农业评估与决策的信息。
服务成果涵盖四大板块。
一、高精度作物与土地利用制图
服务生成了覆盖 18 个二级类别的土地利用与地物分类图,包括水田、旱地、河流、湿地与落叶阔叶林等。
整体分类精度达到 91%。
针对水稻、玉米、大豆三大作物,总体识别精度达 98.4%,召回率 96.36%。
这些结果证明了高分辨率卫星影像与农业遥感方法在超大地理尺度上区分主要作物类型的能力。
更重要的是,成果是空间化组织的——作物信息可以关联到具体位置,而不仅仅是一组汇总统计。
二、作物产量估算
产量估算将遥感提取的作物面积与作物产量模型相结合。
在监测区内的指定实验区,服务生成了约 3.16 亿公斤水稻、8.35 亿公斤玉米、0.45 亿公斤大豆的产量估算。
上述数字为分析所用指定实验区的估算值,不代表整个 7,728 平方公里监测区的总产量。
这一方法的意义在于:卫星遥感为产量模型提供所需的空间化作物面积信息,而农业模型把作物面积及相关信息转化为产量估算——让「太空看到的」与「地面估算的」连接起来。
三、空间化病虫害评估
服务还对选定作物病虫害的严重程度进行了评估。
针对水稻纹枯病、玉米大斑病与大豆蚜虫,分析建立了从「无」到「极重」的五级评估。
分析不是只给出「存在病虫害问题」的笼统结论,而是提供其空间分布与严重程度信息。
这类信息可支撑更精准的农业管理,包括锁定需要重点巡查、靶向施药与防治的区域。
四、极端降雨后的农业影响评估
遥感还被用于评估极端降雨后的农业影响。
通过对比不同日期获取的卫星影像,服务识别出受农业影响的区域并分析其空间分布。
分析表明:玉米受影响区域集中于水库周边低洼地带,水稻受影响区域主要沿大型水体边缘分布。
这类空间信息可支撑灾后评估,并帮助识别在类似风险下更容易受损的农业生产区域。
当农业信息空间化之后,什么改变了?
农业遥感的价值不只在于「能从卫星上采集信息」。
其价值在于改变农业信息的获取、组织与使用方式。
传统以田间为主的方式需要人员到场、逐点采集、多点汇总;对大区域而言,持续实现全覆盖很难。遥感通过提供覆盖大区域的统一空间基准,改变了观测过程。
这并不取代田间调查,而是让田间工作更聚焦:卫星分析先识别作物分布、潜在受影响区域或变化显著的位置,田间人员再把追加核查集中在需要验证或详查的区域。
遥感还使不同时相的观测可以对比,让农情变化的空间化审视成为可能,而不只依赖彼此独立的田间记录或统计报表。
最终得到的不是「又一张图」,而是一套结构化的农业数据集——可用于制图、对比、分析、报告与后续决策。
对大型农业区域而言,这让「观测」与「农业管理」之间建立起更系统的连接。
耘瞳与更大的智慧农业平台
上述农业遥感服务是 Smartwell 耘瞳农业数据平台支撑的能力之一。
耘瞳定位于整合多种农业信息源——卫星影像、无人机影像、气象信息、农业物联网数据与 AI 分析。通过多源融合,平台可在不同空间与时间尺度上支撑农业观测与分析。
Smartwell 正将这些能力纳入更大的智慧农业战略持续发展,应用横跨大规模露天农业与可控环境农业。公司致力于通过数字化平台连接农业观测、数据分析与农业模型,支撑切实的农业管理。
关于 Smartwell Technology Corp.
Smartwell Technology Corp.(TSXV: SMWE)专注于智慧农业、农业数据服务与可控环境农业技术的研发与应用。
公司正通过其技术平台与农业应用,发展覆盖农业遥感、数据融合、AI 农业分析与数字农业管理的能力。
Smartwell 的战略是让农业数据与实际农业应用相连,支撑大规模露天农业与设施农业生产的数字化转型。
← 客户场景